8 minute read
AT A GLANCE
Bonita single family closed July at a $680,000 median, up 9.7 percent year over year, but closed sales fell 9.2 percent and days on market stretched 37.3 percent. Sellers are holding price. Buyers are showing up in smaller numbers.
Bonita condo went the other way. The median dropped to $379,990, down 7.9 percent, and closed sales jumped 22.0 percent. Buyers waited for the price cut and then stepped in.
Underneath the citywide median there are two Bonitas. Coastal 34134 closed at a $725,750 median and 80 days on market. Inland 34135 closed at $475,900 and 60 days. And across all property types, 41 percent of Bonita listings did not close in the last twelve months.
Bonita Springs in July gave us the same single-family versus condo split we saw at Naples on Monday, but with a wrinkle that matters. The single-family side in Bonita is not doing what Naples single-family did. Prices are still climbing on the year, but closed sales are down and days on market are stretching. That is a different tape than Naples ran, and sellers in Bonita should read it carefully.
Kim and I work Bonita every week, so alongside the Domus print we pulled every closed transaction from the SWFL MLS since January 2024 and ran the numbers by zip code, waterfront status, and top-volume subdivision. The submarket layer is where the actionable insight lives.
Single family climbed on price but softened on volume
The Bonita Springs single family median closed July at $680,000, up 9.7 percent from July 2025 and down 9.3 percent from June. That price-side headline looks similar to Naples until you read the volume line. Closed sales came in at 59, down 9.2 percent year over year. Naples SFH closed 377 in July, up 13.2 percent on the year. Bonita moved in the opposite direction on the same calendar month.
Active single family inventory landed at 317 homes, down 31.1 percent versus last July. Months of supply now reads 5.4, off 24.1 percent from a year ago. New listings hit 63 for the month, down 24.1 percent year over year.
Here is the picture those numbers paint. Bonita single-family sellers are holding the line on price, buyers are showing up in smaller numbers, and inventory is thin because owners are not deciding to list. That is not the same market as Naples, where both sides showed up and executed. In Bonita, the sellers who are on the market are getting their price, but fewer of them are on the market and the buyers who do show up are taking longer to write.
The days on market number is where that shows up hardest. Bonita SFH ran 81 days in July, up 37.3 percent from last July. Sale-to-list came in at 95.6 percent. Median sold price per square foot ran $332.
Read this next
Naples Housing Market Update for July 2026 (Single Family and Condo)Condo went the other way, and closed sales went up hard
The Bonita condo and townhouse median came in at $379,990, down 7.9 percent from July 2025 and down 14.0 percent from June. Closed sales for July were 61 units, up 22.0 percent year over year. Buyers waited for the price cut and stepped in aggressively. The 22 percent volume gain year over year is a stronger buyer response than Naples ran on the condo side.
Active condo inventory at 408 is down 30.6 percent year over year. Months of supply reads 6.7, up 13.9 percent month over month on lower monthly volume. New listings hit 81 for the month, up 5.2 percent from last July and up 26.6 percent from June.
Here is how the two sides of the Bonita market compare on the same July print.
| July 2026 metric | Single family | Condo and townhouse |
|---|---|---|
| Median closed price | $680,000 (up 9.7% YoY) | $379,990 (down 7.9% YoY) |
| Closed sales | 59 (down 9.2% YoY) | 61 (up 22.0% YoY) |
| Active inventory | 317 (down 31.1% YoY) | 408 (down 30.6% YoY) |
| Months of supply | 5.4 (down 24.1% YoY) | 6.7 (up 13.9% MoM) |
| New listings | 63 (down 24.1% YoY) | 81 (up 5.2% YoY, up 26.6% MoM) |
| Median days on market | 81 (up 37.3% YoY) | 91 |
| Sale-to-list ratio | 95.6% | 94.0% |
| Median sold price per sq ft | $332 | $234 |
That new listing count is worth pausing on. Bonita condo sellers came to market in July at the highest pace of 2026, and buyers absorbed enough of the new supply to keep months of supply from spiking.
If you are a condo shopper in Bonita and you have been waiting for a signal, the July print is your signal. Prices moved. Inventory is refilling. Sellers are testing new numbers.
Read this next
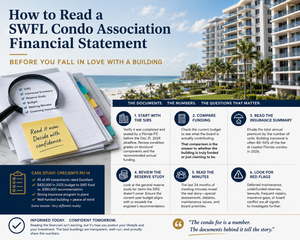
How to Read a SWFL Condo Association Financial Statement Before You Fall in Love With a BuildingThe two Bonitas inside the one citywide median
Bonita Springs is not one market. It is two, split cleanly by zip code, and the citywide numbers hide what a buyer is actually walking into.
I pulled every closed sale in Bonita from the SWFL MLS for the trailing twelve months, August 2025 through July 2026. Here is what the tape says.
| Trailing 12 months, all property types | 34134 (west, coastal) | 34135 (east, inland) |
|---|---|---|
| Closed sales | 718 | 1,205 |
| Median close price | $725,750 | $475,900 |
| Median price per sq ft | $401 | $283 |
| Median days on market | 80 | 60 |
| Median sale-to-list ratio | 94.4% | 96.0% |
| Share of closes waterfront | 52% | 42% |
| What is in it | Bonita Bay, Pelican Landing, Barefoot Beach, Gulf-front and bay-front condos | Golf and gated communities off US 41, mostly lake and canal frontage |
The east side of Bonita is closing homes twenty days faster at a sale-to-list ratio 1.6 points tighter than the west side, at 65 percent of the price per square foot. That is what a healthier absorption market looks like next to a heavier, slower luxury coastal market. Both are working. They are working differently.
The Gulf-access premium is $192,500
For buyers evaluating waterfront specifically, the trailing twelve months show 232 Gulf-access closes at a $727,500 median versus 1,697 non-Gulf-access closes at a $535,000 median. That is a $192,500 premium for direct Gulf access on the same twelve months of Bonita transactions. If you are shopping waterfront, that number is your negotiating anchor.
| Trailing 12 months | Closed sales | Median close price | Median days on market |
|---|---|---|---|
| Gulf access | 232 | $727,500 | 97 |
| No Gulf access | 1,697 | $535,000 | 62 |
| Premium | $192,500 | 35 days slower |
Where the buyers actually went
Top volume in Bonita over the last twelve months landed in five subdivisions.
| Community | Closed sales | Median close price | Median days on market |
|---|---|---|---|
| Bonita National Golf and Country Club | 99 | $750,000 | 60 |
| Village Walk of Bonita Springs | 81 | $485,000 | 30 |
| Valencia Bonita (55-plus) | 62 | $847,450 | 60 |
| Paloma | 39 | $435,000 | 69 |
| Seasons at Bonita | 39 | $565,000 | 62 |
| Worthington | 26 | $445,000 | 106 |
| Beach and Tennis Club | 23 | $292,000 | 103 |
Village Walk of Bonita Springs is the fastest-moving community in the top ten at 30 median days on market. At the other end of the spectrum, Worthington ran 106 median days on 26 closes and Beach and Tennis Club ran 103 days on 23 closes. Both are older buildings and both are absorbing at a slower pace than the newer inventory. That is not a valuation problem. It is a tape-time problem. Prepared listings in older Bonita buildings need to price to the current comps the first week or they add another month to their days-on-market count.
The 41 percent number Bonita sellers need to see
Kim and I pulled the same twelve months of expired, terminated, and withdrawn listings alongside the sold set to see what actually happened to Bonita inventory. Twelve months, all property types.
| Bonita listings, August 2025 through July 2026 | Count | Share |
|---|---|---|
| Sold | 1,931 | 58.8% |
| Expired, terminated, or withdrawn | 1,354 | 41.2% |
| Total listings resolved | 3,285 | 100% |
1,931 Bonita listings sold. 1,354 came off the market unsold. Success rate: 58.8 percent.
Read that number twice. Forty-one percent of Bonita listings did not close in the last twelve months. They expired, the seller pulled them, or the contract terminated. In a market where the citywide sale-to-list ratio is only running 94 to 96 percent, that failure rate is the leading indicator. Sellers who priced to the current comps in the first week largely closed. Sellers who priced to what they hoped for largely did not.
This is the same story the July auction results told, and it is why the auction format keeps working for the sellers who want out on a deadline. On the traditional marketing side, the answer is simpler: price to the first week's comps, not to a hopeful number.
What a buyer should do this month
Bonita on the single-family side is not going to hand you a discount the way the current sales-volume drop might suggest. Sellers who came to market at fair prices are the ones getting their number. Come with a lender letter, know which zip code you are actually targeting, and be ready to write on a well-prepared listing quickly. The exception is at the top of the market and in the older coastal buildings, where days on market and negotiation room both open up. A hundred-day-on-market Worthington or Beach and Tennis Club listing is a different negotiation than a thirty-day Village Walk listing.
On the condo side, the July print is a window. Prices moved down. New listings arrived. Buildings with clean association paperwork are what I would look at first, for the same reason we walked through in yesterday's Q&A post. The SIRS-compliant buildings are the ones that will trade tighter to list once the market recognizes what the paperwork sorted out.
What a seller should do this month
Single family sellers still have wind at their back on price, but the sales-volume drop and the 37 percent stretch in days on market are the warning label. Both tell you the same thing. The buyers who wrote at last summer's price are not the same buyers walking in now. If you priced to a hopeful number in June, you are already on the wrong side of the July comps.
Condo sellers have the harder decision. Volume is up 22 percent year over year, so buyers are there. Median is down 7.9 percent, so pricing to the current three-month comps in your building matters. Owners in a building with a completed SIRS and a funded reserve plan should put that on the front page of the listing. That paperwork is worth real dollars right now.
And every Bonita seller, regardless of tier, should factor the 58.8 percent success rate into the pricing conversation. Four in ten Bonita listings did not close in the last twelve months. The ones that closed almost all priced correctly the first week.
Kim and I are showing Bonita every week. If you want to know what the numbers look like inside your building, your street, or your subdivision specifically, call Kim at 239-420-9027 or text me at 239-355-4040. We will send you the tape for your specific slice, not the citywide average.
The next SWFL market update on the calendar is Estero on Monday.
The Hawley Team at Keller Williams Fort Myers and the Islands
(239) 420-9027 | martin@teamhawley.com | teamhawley.com
Disclosures
Citywide July 2026 figures come from the Domus Analytics Market Review dashboard, pulled 8/19/2026 for July 2026 close data. Submarket, waterfront, subdivision, and listing-outcome detail comes from Bonita Springs MLS extracts covering January 2024 through 8/18/2026: 4,612 sold plus 3,491 expired, terminated, or withdrawn plus 864 active and pending listings.
Trailing twelve month figures cover closings between August 1, 2025 and July 31, 2026. Medians are medians, not averages, and a median can move on mix alone. Small subdivision samples are exactly that, and a single unusual sale can move a small sample meaningfully.
MLS data is deemed reliable but is not guaranteed. Figures are subject to revision as late reporting and corrections post. This post is educational and is not legal, tax, insurance, financial, or appraisal advice. No specific outcome on any individual property is promised or implied.
Each Keller Williams office is independently owned and operated. Equal Housing Opportunity.